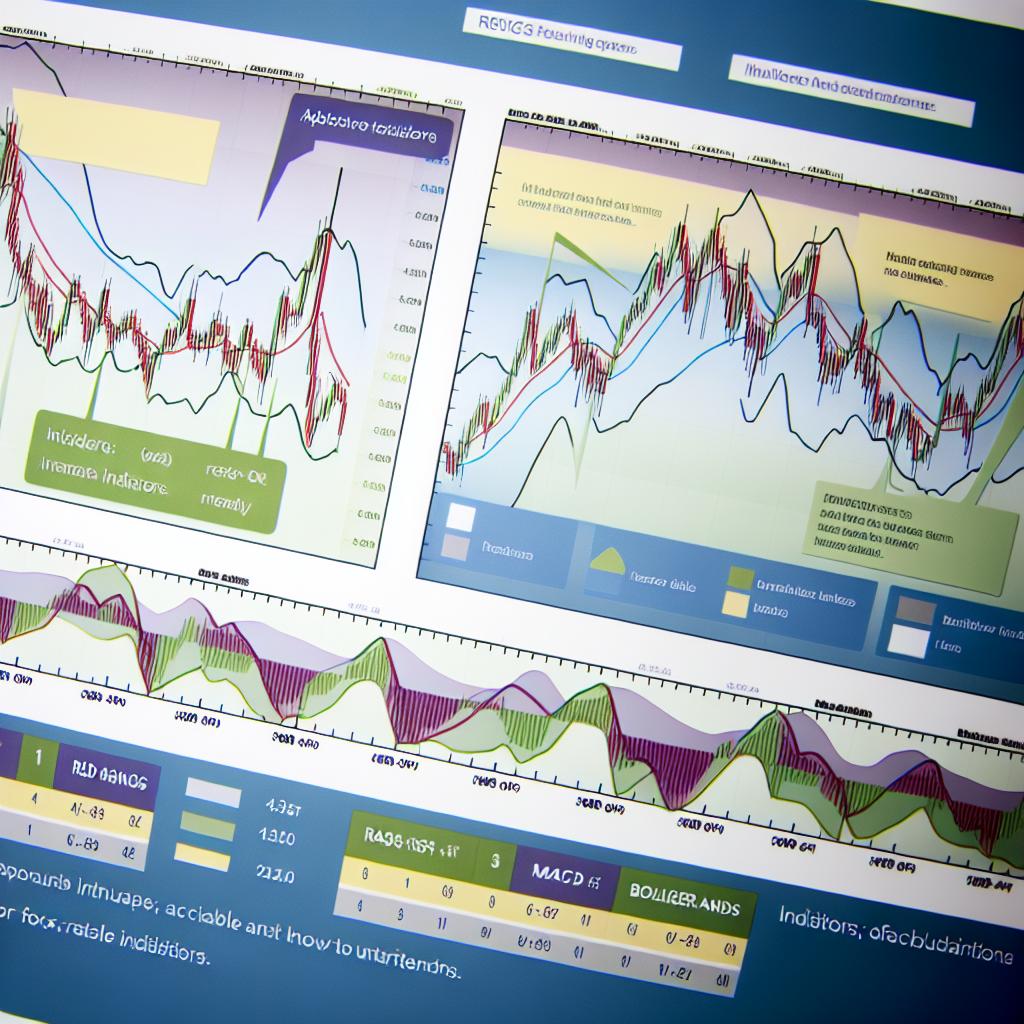
Understanding Forex Indicators
In the world of foreign exchange (Forex) trading, the ability to analyze market trends effectively is crucial. Among the various tools and indicators used by traders, the Relative Strength Index (RSI), Moving Average Convergence Divergence (MACD), and Bollinger Bands are some of the most popular.
Relative Strength Index (RSI)
The RSI is a momentum oscillator that measures the speed and change of price movements. By quantifying and enabling the analysis of price momentum, it aids traders in identifying the potential reversal points in a given market. The RSI indicator fluctuates on a scale of 0 to 100 and is primarily used to determine overbought or oversold conditions within a market. Typically, a reading above 70 suggests that a currency pair might be overbought and due for a correction, while an RSI below 30 might indicate that it is oversold and could experience an upward price movement.
One of the primary advantages of using RSI is its ability to help traders foresee potential market reversals. The formula for calculating RSI is relatively straightforward:
RSI = 100 - (100 / (1 + RS))
where RS represents the average of x days’ up closes divided by the average of x days’ down closes. Typically, a 14-day period is utilized in the calculation, but traders can adjust the settings according to their trading strategy or the time frame they wish to analyze.
While RSI is a valuable tool, it’s important for traders to use it alongside other indicators and analysis techniques to avoid relying solely on a single metric for decision-making. For more comprehensive information on using RSI effectively, traders often refer to educational platforms such as Investopedia.
Moving Average Convergence Divergence (MACD)
MACD is a trend-following momentum indicator that showcases the relationship between two exponential moving averages (EMAs) of a currency pair’s price. It is calculated by subtracting the 26-period EMA from the 12-period EMA. The result of this calculation yields the MACD line, a core component of the MACD indicator.
In addition to the MACD line, a nine-day EMA of the MACD, known as the signal line, is plotted on top of the MACD line. This signal line serves as a trigger for potential buying or selling actions. When the MACD line crosses above the signal line, it can be interpreted as a bullish signal, suggesting a potential rise in prices. Conversely, if the MACD line crosses below the signal line, it is often taken as a bearish signal, indicating a potential decline in prices.
MACD is highly versatile and can help traders identify trends, momentum, and potential reversal points in various market scenarios. The indicator’s adaptability makes it appealing to both novice and experienced traders. For those interested in learning more about using the MACD effectively, BabyPips offers insightful guidance and examples.
Bollinger Bands
Bollinger Bands are a volatility indicator that comprises three lines. The middle line is an SMA (Simple Moving Average), typically set to a 20-day period. The upper and lower bands are positioned two standard deviations away from the middle band, capturing a wide range of price movements.
Bollinger Bands are particularly noteworthy for their ability to represent market volatility visually. When market volatility diminishes, the bands constrict, indicating potential price consolidation and possible future breakouts. Conversely, when the bands expand, it reflects high volatility, often seen during periods of price instability or market events.
Recognizing these band formations can help traders anticipate possible market movements. However, Bollinger Bands are most effective when used in conjunction with other indicators or analysis tools. Traders frequently explore resources like Forex.com to deepen their understanding of how to trade with Bollinger Bands.
Conclusion
Each of the discussed indicators—Relative Strength Index (RSI), Moving Average Convergence Divergence (MACD), and Bollinger Bands—possesses distinct characteristics that contribute to the analytical prowess of Forex traders. While these tools are valuable on their own, traders often find the most success using them in conjunction with other technical and fundamental analysis tools.
The path to successful Forex trading lies in combining insights from multiple sources and crafting a well-rounded strategy. For instance, while RSI might signal an overbought condition, corroborating this with MACD’s trend indication might provide a clearer picture. Similarly, observing Bollinger Bands in tandem with other momentum indicators can enhance the evaluation of price volatility and trend direction.
In summary, the key to maximizing the potential of these indicators lies in understanding their intricacies and applying them judiciously within the context of a broader trading strategy. By continuously learning and integrating new approaches, Forex traders can refine their strategies and improve their chances of success in this dynamic market environment.